What's so Hard About Representing Deep Learning Models?
Many papers in the field are rather indecipherable, not providing in prose, diagrams, or equations all the information needed to know what an algorithm actually does. I believe this comes down to the difficulty of expressing the exact size of data throughout a model and how operations are broadcast to act over specific axes. This is an operation's metadata, and Neural Circuit Diagrams (NCDs) are really, really good at expressing it.
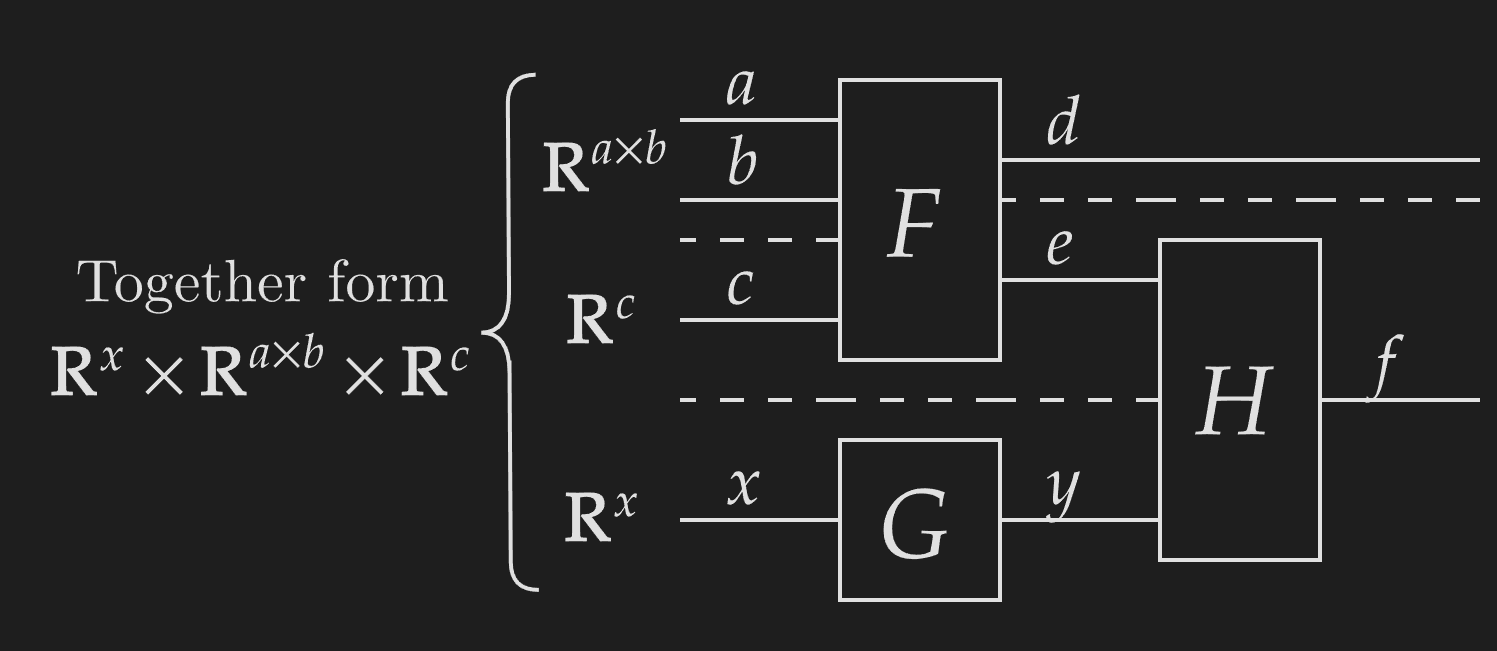
NCDs represent functions with boxes/pictograms and arrays by solid wires labeled with their axis sizes. We use dashed lines to construct tuples or parallel functions and have continuing lines represent identity functions. Horizontally placing functions with matching codomains and domains composes them, and this can be used to indicate which tuple segments a function acts on.
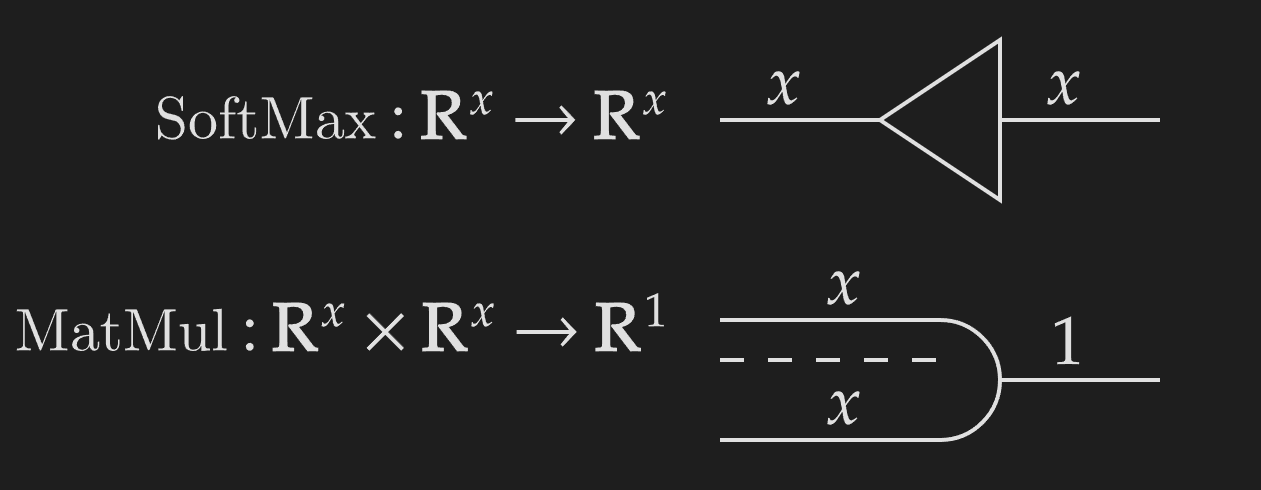
We use pictograms to represent common functions.
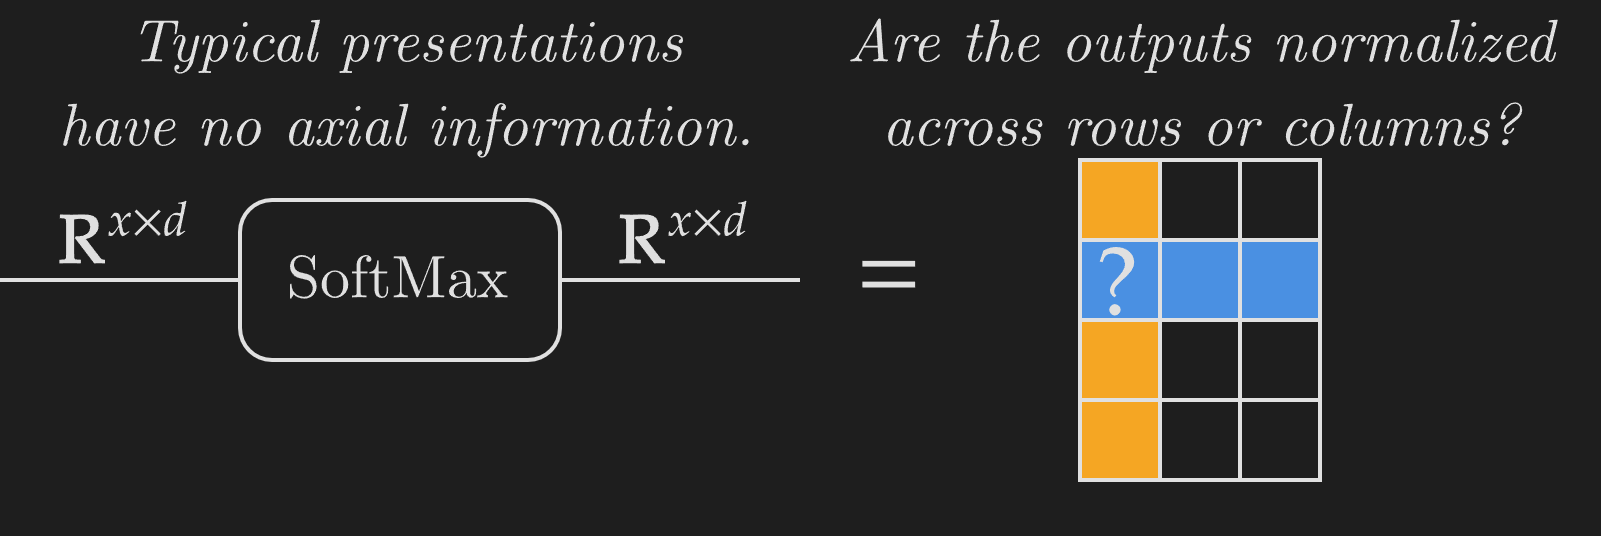
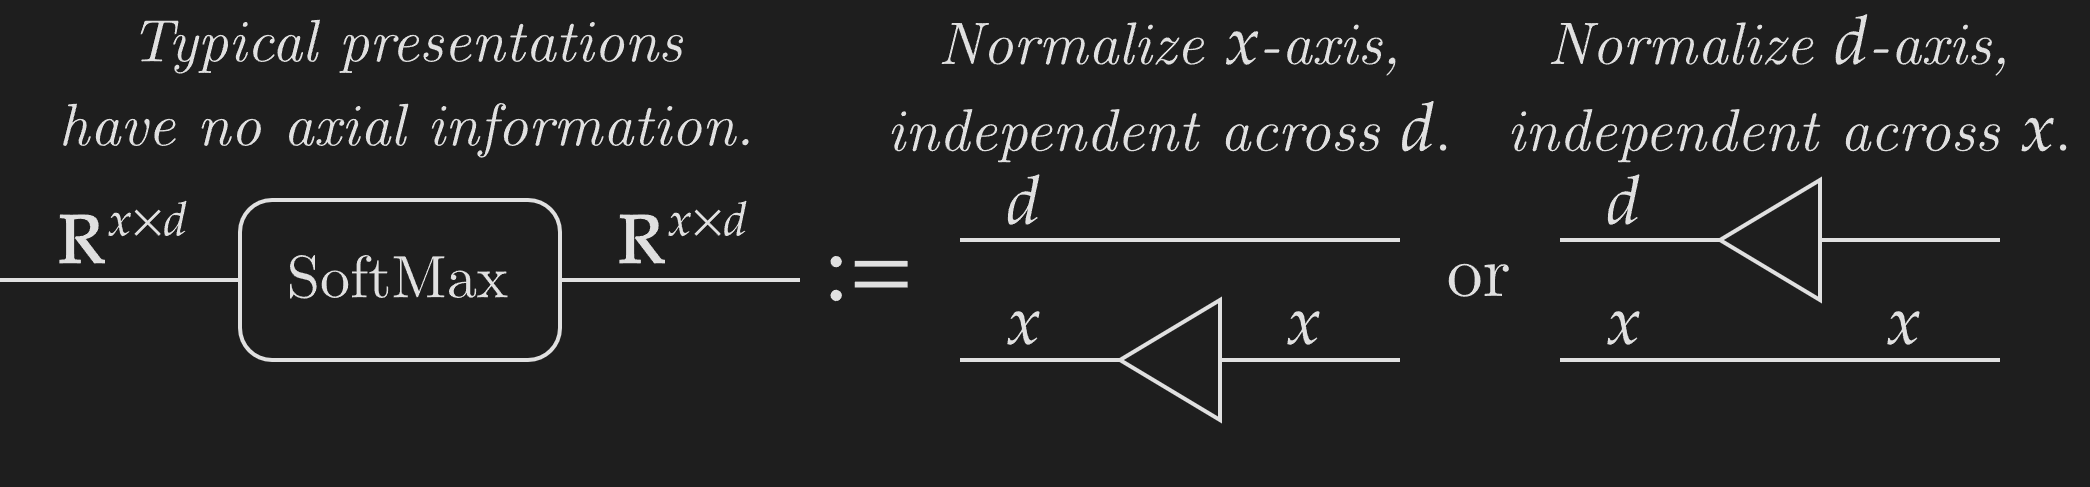
Deep learning research has a big issue with representing functions' metadata. Polymorphic operations like SoftMax or matrix multiplication can act over axes of various sizes and are essential to letting models scale over large amounts of data. But expressing metadata is difficult. Polymorphic functions can act over specific axes, so a SoftMax over rows is completely different from a SoftMax over columns. Expressing this metadata information is critical, but most presentations of deep learning models completely miss this.
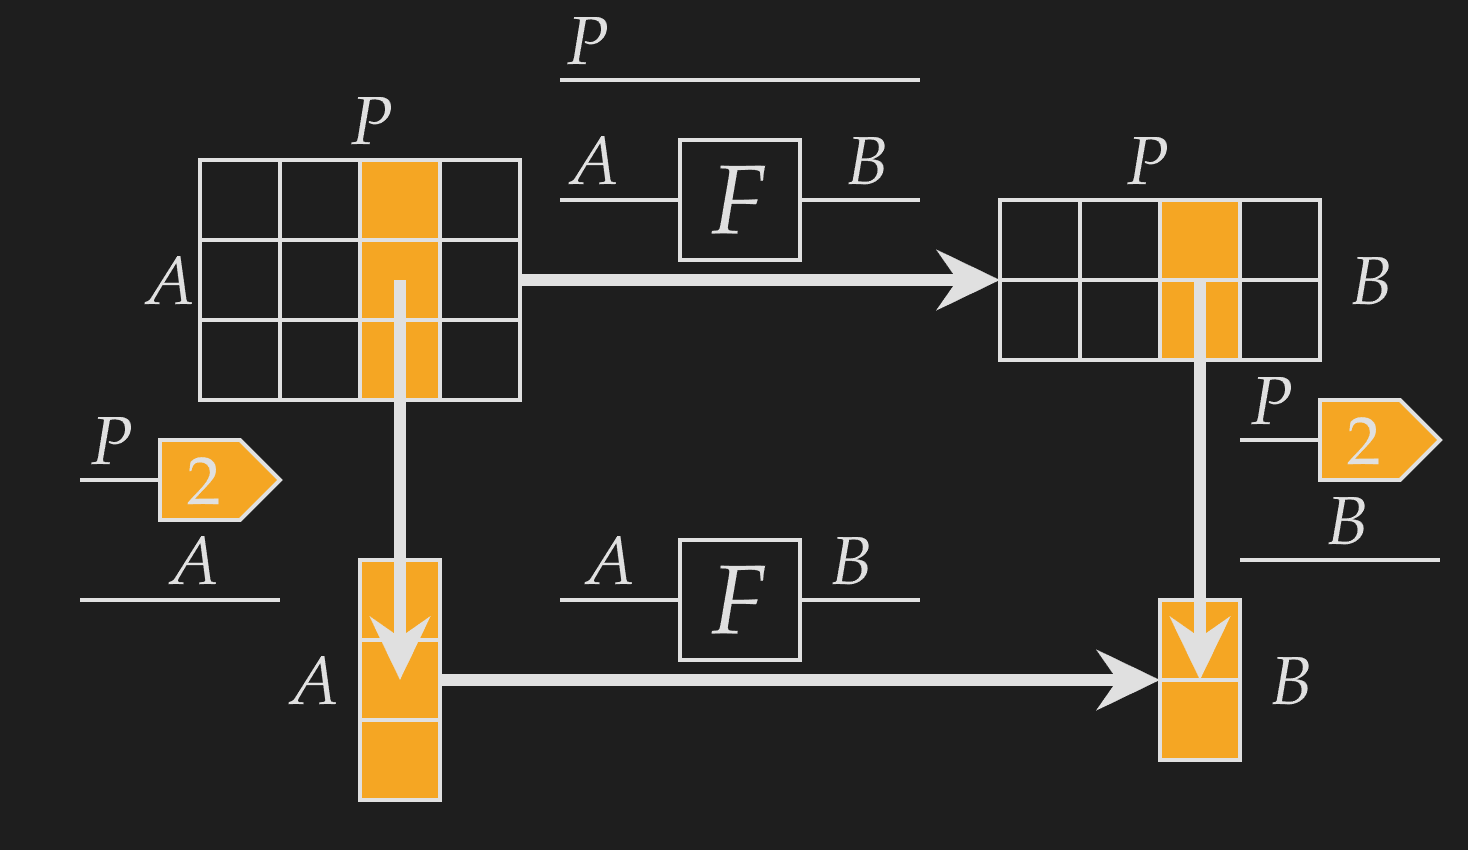
With NCDs, we can define indexes as functions that take an array and extract a particular row or column. Indexes exhibit a very powerful categorical property called projection. Functions can be constructed by their value for each projection, in this case, each index along an axis.
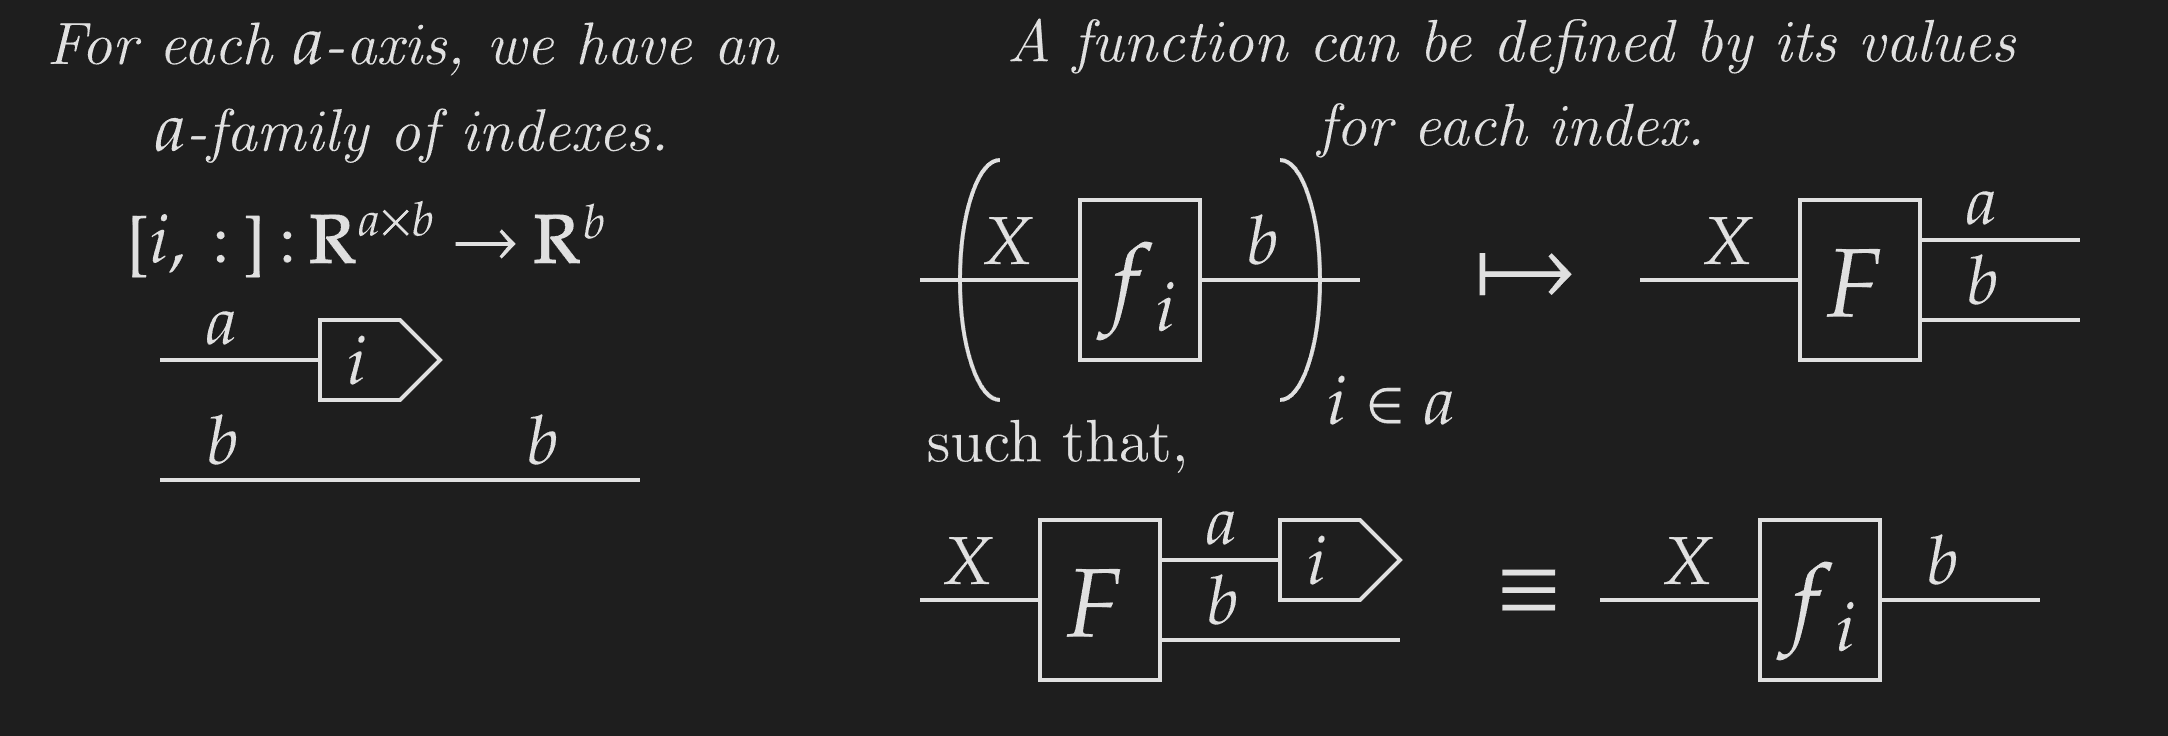
Using this, we can define weaving. The most basic form of weaving takes an underlying function and an identity weave of to give a new function . This weaved function is defined over each index of the codomain -axis as,
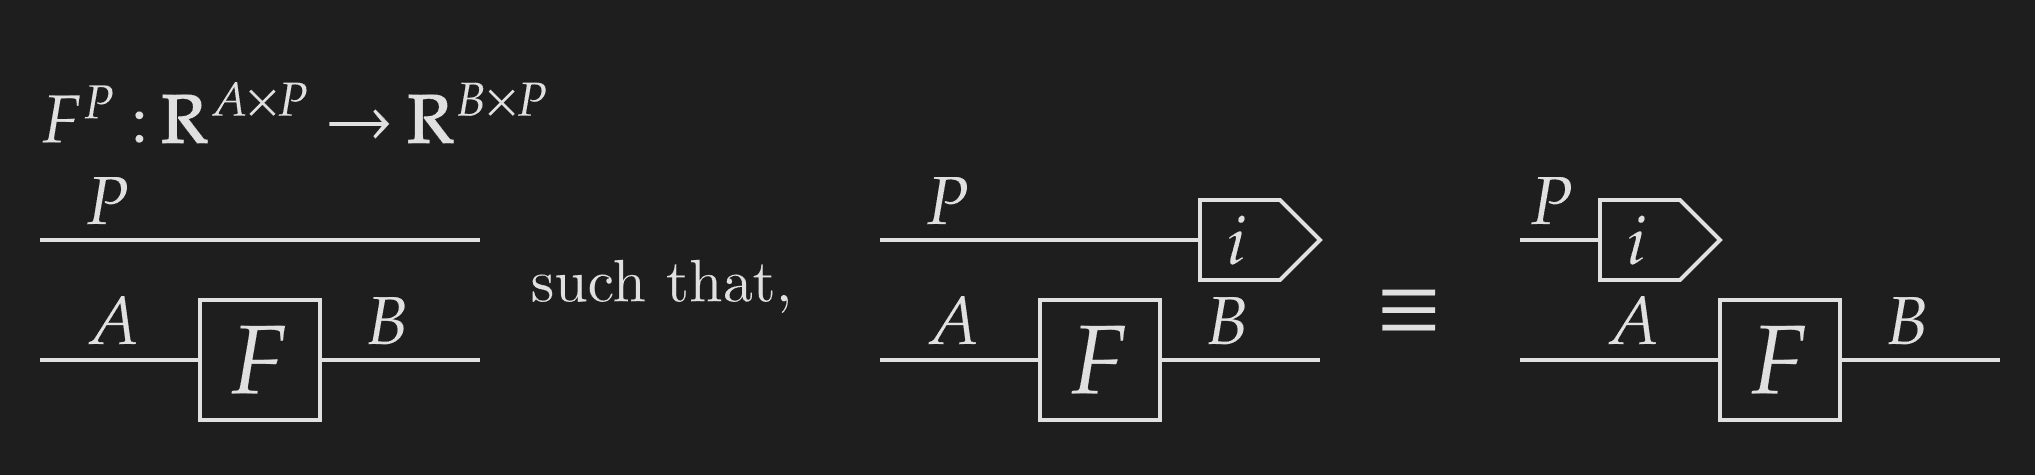
This function is defined by known functions (the indexes and function ), and therefore must exist! We can be confident that the above diagram represents a meaningful function, as the output is defined for each index.
Furthermore, we see that it corresponds to applying the function independently over the additional -axis. Extracting a column and applying is the same as applying across and extracting the same column. This means that is applying onto each column independently.
Expressing SoftMax for a specific axis now becomes straightforward. Instead of the typical presentation which does not express the detail of axes, weaves let us specify the exact axis on which SoftMax acts.
We can go much further, with non-identity weaves indicating reindexings, weaves working with tuple domains, weaves composing independently to underlying functions (sliding), and weaves corresponding to Penrose graphical notation for linear operations. They make concepts like multi-head attention and grouped query attention easy to express.
Weaves will also be used to decompose functions to fit them onto lower-level memory, and are therefore integral to understanding fusion. I'll post about all this in the coming days, so stay in the loop!